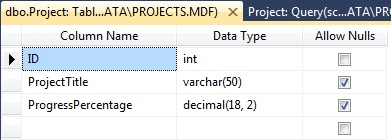
Step-1: Create a table in your
database.

Step-2: Insert
your values into your table.


Step-3: Then add a
chart control to your page.
<asp:Chart ID="Chart1" runat="server">
<Series>
<asp:Series Name="Series1">
</asp:Series>
</Series>
<ChartAreas>
<asp:ChartArea Name="ChartArea1"
Area3DStyle-Enable3D="true" >
</asp:ChartArea>
</ChartAreas>
</asp:Chart>
Step-4: Then
add this code behind method to your page and call this method whenever you want
to load your chart.
protected void Load_Chart()
{
SqlConnection con = new SqlConnection("---Your Connection
string---“);
SqlCommand com;
com = new SqlCommand("select
ProjectTitle,ProgressPercentage from Project",
con);
DataTable dt = new DataTable();
SqlDataAdapter da = new SqlDataAdapter(com);
da.Fill(dt);
Chart1.DataSource =
dt;
Chart1.DataBind();
Chart1.Series[0].XValueMember = "ProjectTitle";
Chart1.Series[0].YValueMembers = "ProgressPercentage";
Chart1.Series[0].ToolTip
= "#VAL";
Chart1.ChartAreas[0].AxisX.Interval = 1;
}
Step-5: The
final output:
Output with showing
tool tip:

No comments:
Post a Comment
Please don't spam, spam comments is not allowed here.