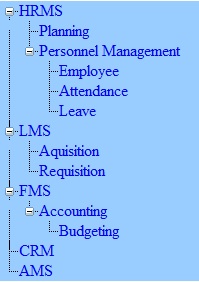
In this example, I am showing you
how to bind a treeview. Here, I am having a table in database where we store
Modules and their sub-modules having parent-child like
relationship.
Step-1: Add a TreeView to your .aspx
Page.
<asp:TreeView ID="ModuleTreeView"
runat="server"
ShowLines="true"
PopulateNodesFromClient="false" BackColor="#99CCFF"
style="width:100%"
ShowExpandCollapse="false">
</asp:TreeView>
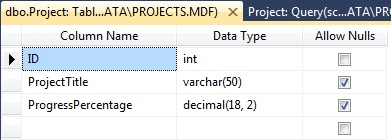
Step-2: Add a table
named "Module" to your
database which will store all modules and sub-modules.
Step-3: Insert some
values into your table.
All those modules which do not have any
parent modules, their ParentModuleID is set to '0(Zero)'.
Step-4: Add these following code behind methods to the
page.
SqlConnection con = new SqlConnection("----Your Connection
String----");
SqlCommand com;
protected void
Page_Load(object sender, EventArgs e)
{
ModuleTreeView.ExpandAll();
FillTreeView();
}
//----- Get all the module details from database
-----//
public DataTable
GetModuleDetails()
{
com = new SqlCommand("select
ModuleID,ModuleName,ParentModuleID from Module",
con);
SqlDataAdapter da = new SqlDataAdapter(com);
DataTable dt = new DataTable();
da.Fill(dt);
return dt;
}
//----Method to fill the
treeview-----//
public void
FillTreeView()
{
DataTable Modules = new DataTable();
Modules =
GetModuleDetails();
ModuleTreeView.Nodes.Clear();
PopulateTreeNode(Modules, null,
0);
}
//----- Method to bind the treeview nodes as per the
moduleID and ParentModuleID-----//
private void
PopulateTreeNode(DataTable ModuleList, TreeNode parent, int parentID)
{
TreeNodeCollection
baseNodes;
TreeNode node;
if (parent == null)
{
baseNodes =
ModuleTreeView.Nodes;
}
else
{
baseNodes =
parent.ChildNodes;
}
foreach (DataRow
dtRow in
ModuleList.Rows)
{
if (int.Parse(dtRow["ParentModuleID"].ToString()) ==
parentID)
{
node = new TreeNode();
node.Text =
dtRow["ModuleName"].ToString();
node.Value =
dtRow["ModuleID"].ToString();
node.SelectAction = TreeNodeSelectAction.Select;
baseNodes.Add(node);
PopulateTreeNode(ModuleList, node, int.Parse(dtRow["ModuleID"].ToString()));
}
}
ModuleTreeView.ExpandAll();
}
Now we are
done and we can find the result by debugging the page.
The
Final Output:
Thanks shibashish mohanty